57 autonomous experiments, 7 hours, RTX 3060. Why smaller models win on consumer hardware.
On March 7, 2026, Andrej Karpathy pushed a 630-line Python script to GitHub and went to sleep. By morning, his AI agent had run 50 experiments on an H100, discovered 20 optimizations on already-tuned code, and committed the proof to git. He called the repo AutoResearch. It picked up 71,000 stars in weeks.
The H100 it was built for has 80GB of VRAM and costs roughly $30,000. My GPU has 12GB and cost $300.
I ran it anyway.
What AutoResearch Actually Does
Three files. That’s the whole system.
prepare.py handles data: downloads a text corpus, trains a tokenizer, provides the evaluation function. This file is immutable. Nobody touches it, not you, not the agent.
train.py is the agent’s sandbox: 630 lines containing a GPT model, the optimizer (Muon + AdamW), and the training loop. Architecture, hyperparameters, batch size, everything is fair game.
program.md is where the human writes research directions in plain English. The agent reads it, proposes a code change, commits it, trains for exactly 5 minutes, measures validation bits per byte (val_bpb, lower is better), and either keeps the change or reverts it. Then loops.
The design is deliberately constrained. One GPU. One file. One metric. Fixed 5-minute training budget per experiment. The agent accumulates improvements like a ratchet: it only moves forward.
Karpathy’s framing for what comes next is characteristically deadpan: “Research is now entirely the domain of autonomous swarms of AI agents running across compute cluster megastructures in the skies.” This repo, he says, is how it all began.
The Hardware Gap
Here’s what I was working with versus what the repo was designed for:
| Spec | H100 | RTX 3060 |
|---|---|---|
| VRAM | 80 GB | 12 GB |
| bf16 TFLOPS | 989.5 | ~101 |
| Memory bandwidth | 3.35 TB/s | 360 GB/s |
| Approximate cost | $30,000 | $300 |
6.7x less VRAM. ~10x less compute. 9.3x less memory bandwidth.
The question wasn’t whether the 3060 could match H100 results. It can’t. The question was whether the AutoResearch pattern, agent-driven autonomous experimentation, works at all on hardware most developers actually own.
Four Changes to Make It Run
Reading through train.py, I found 3 blockers and one logging fix. The adaptation took a couple of hours of analysis, not days.
Change 1: Flash Attention 3 to SDPA
The original code imports Flash Attention 3 via a kernels package. FA3 is a Hopper-specific optimization (SM 9.0). The RTX 3060 is Ampere (SM 8.6). Won’t work.
The fix: replace FA3 with PyTorch’s built-in F.scaled_dot_product_attention. SDPA auto-dispatches to the best backend available on your GPU (Flash Attention 2 on Ampere, memory-efficient attention as fallback). The interface change is just a tensor transpose: FA3 takes (B, T, H, D), SDPA takes (B, H, T, D).
One trade-off: SDPA doesn’t support sliding window attention natively. The original code uses a window_pattern = "SSSL" (3 short-window layers + 1 full-context layer). All layers now run full causal attention. At the batch sizes I was running, this added negligible VRAM.
Change 2: Batch size 128 to 16
This was the critical change. And it required understanding where VRAM actually goes.
The model itself is tiny: 50M parameters at bf16 occupies ~100MB. Optimizer states add ~300MB. Together, they barely dent 12GB.
The real consumer is activation memory, specifically the attention score tensor. It scales as B × H × T²: batch size times attention heads times sequence length squared. At the default config (batch=128, seq_len=2048, 4 heads), a single attention layer’s score tensor needs:
128 × 4 × 2048 × 2048 × 2 bytes = ~8 GB8GB. Per layer. For one tensor.
At batch=16, that same tensor drops to ~1GB. The model, the optimizer, everything else stays the same. Gradient accumulation steps increase from 2 to 16 to preserve the effective batch size at 524K tokens per update.
I tried batch=32. It OOMed at 10.2GB.
Change 3: TFLOPS constant
The code calculates Model FLOPS Utilization (MFU) using H100_BF16_PEAK_FLOPS = 989.5e12. Changed to GPU_BF16_PEAK_FLOPS = 101e12 and updated the 3 references. Cosmetic, but important for accurate performance logging.
Change 4: Timeout adjustment
On the H100, evaluation of 20M validation tokens takes ~25 seconds. At batch=16 on the 3060, it takes 197 seconds. Training itself finishes in 305 seconds. So eval is 40% of total wall time. The agent loop timeout needed 15 minutes, not 10. This changed experiment cadence from ~12/hour to ~7/hour.
The Baseline
First run. No changes beyond the four above. Same 50M parameter model, same architecture, same learning rates.
val_bpb:     1.6148
peak VRAM:   6,150 MB (of 12,288 available)
steps:       58
MFU:         19.5%
throughput:  80K tokens/sec
No OOM. 6.1GB headroom remaining. Loss curve dropped cleanly from 9.01 to 4.68 over 58 steps.
That headroom was misleading, though. peak_vram_mb is PyTorch’s max_memory_allocated(), and it misses buffers that torch.compile pre-allocates during graph compilation. When I tried batch=32, it OOMed at 10.2GB despite the baseline reporting only 6.1GB used. A 4GB ghost. Never trust reported peak VRAM alone to size your batch.
One more gotcha: batch size is quantized, not continuous. TOTAL_BATCH_SIZE % (DEVICE_BATCH_SIZE × seq_len) must equal 0 for gradient accumulation. With seq_len=2048 and TOTAL_BATCH_SIZE=524,288, valid batch sizes are 1, 2, 4, 8, 16, 32, 64… There’s nothing between 16 and 32. When 32 OOMs and 16 fits, you can’t “try 24.” You’re locked in.
The Overnight Run: 57 Experiments
I pointed Claude Code at the repo with an adapted program.md containing hardware constraints, baseline numbers, and VRAM limits. Launched it in a tmux session at midnight and went to sleep.
tmux new-session -d -s autoresearch \
  'cd autoresearch && claude "Read program.md and start the experiment loop."'
By 7:15 AM, the agent had completed 55 experiments. It stalled on experiment 56 when its context window filled up after ~7 hours. Two more experiments ran in a resumed afternoon session.
Here’s what happened, broken into phases.
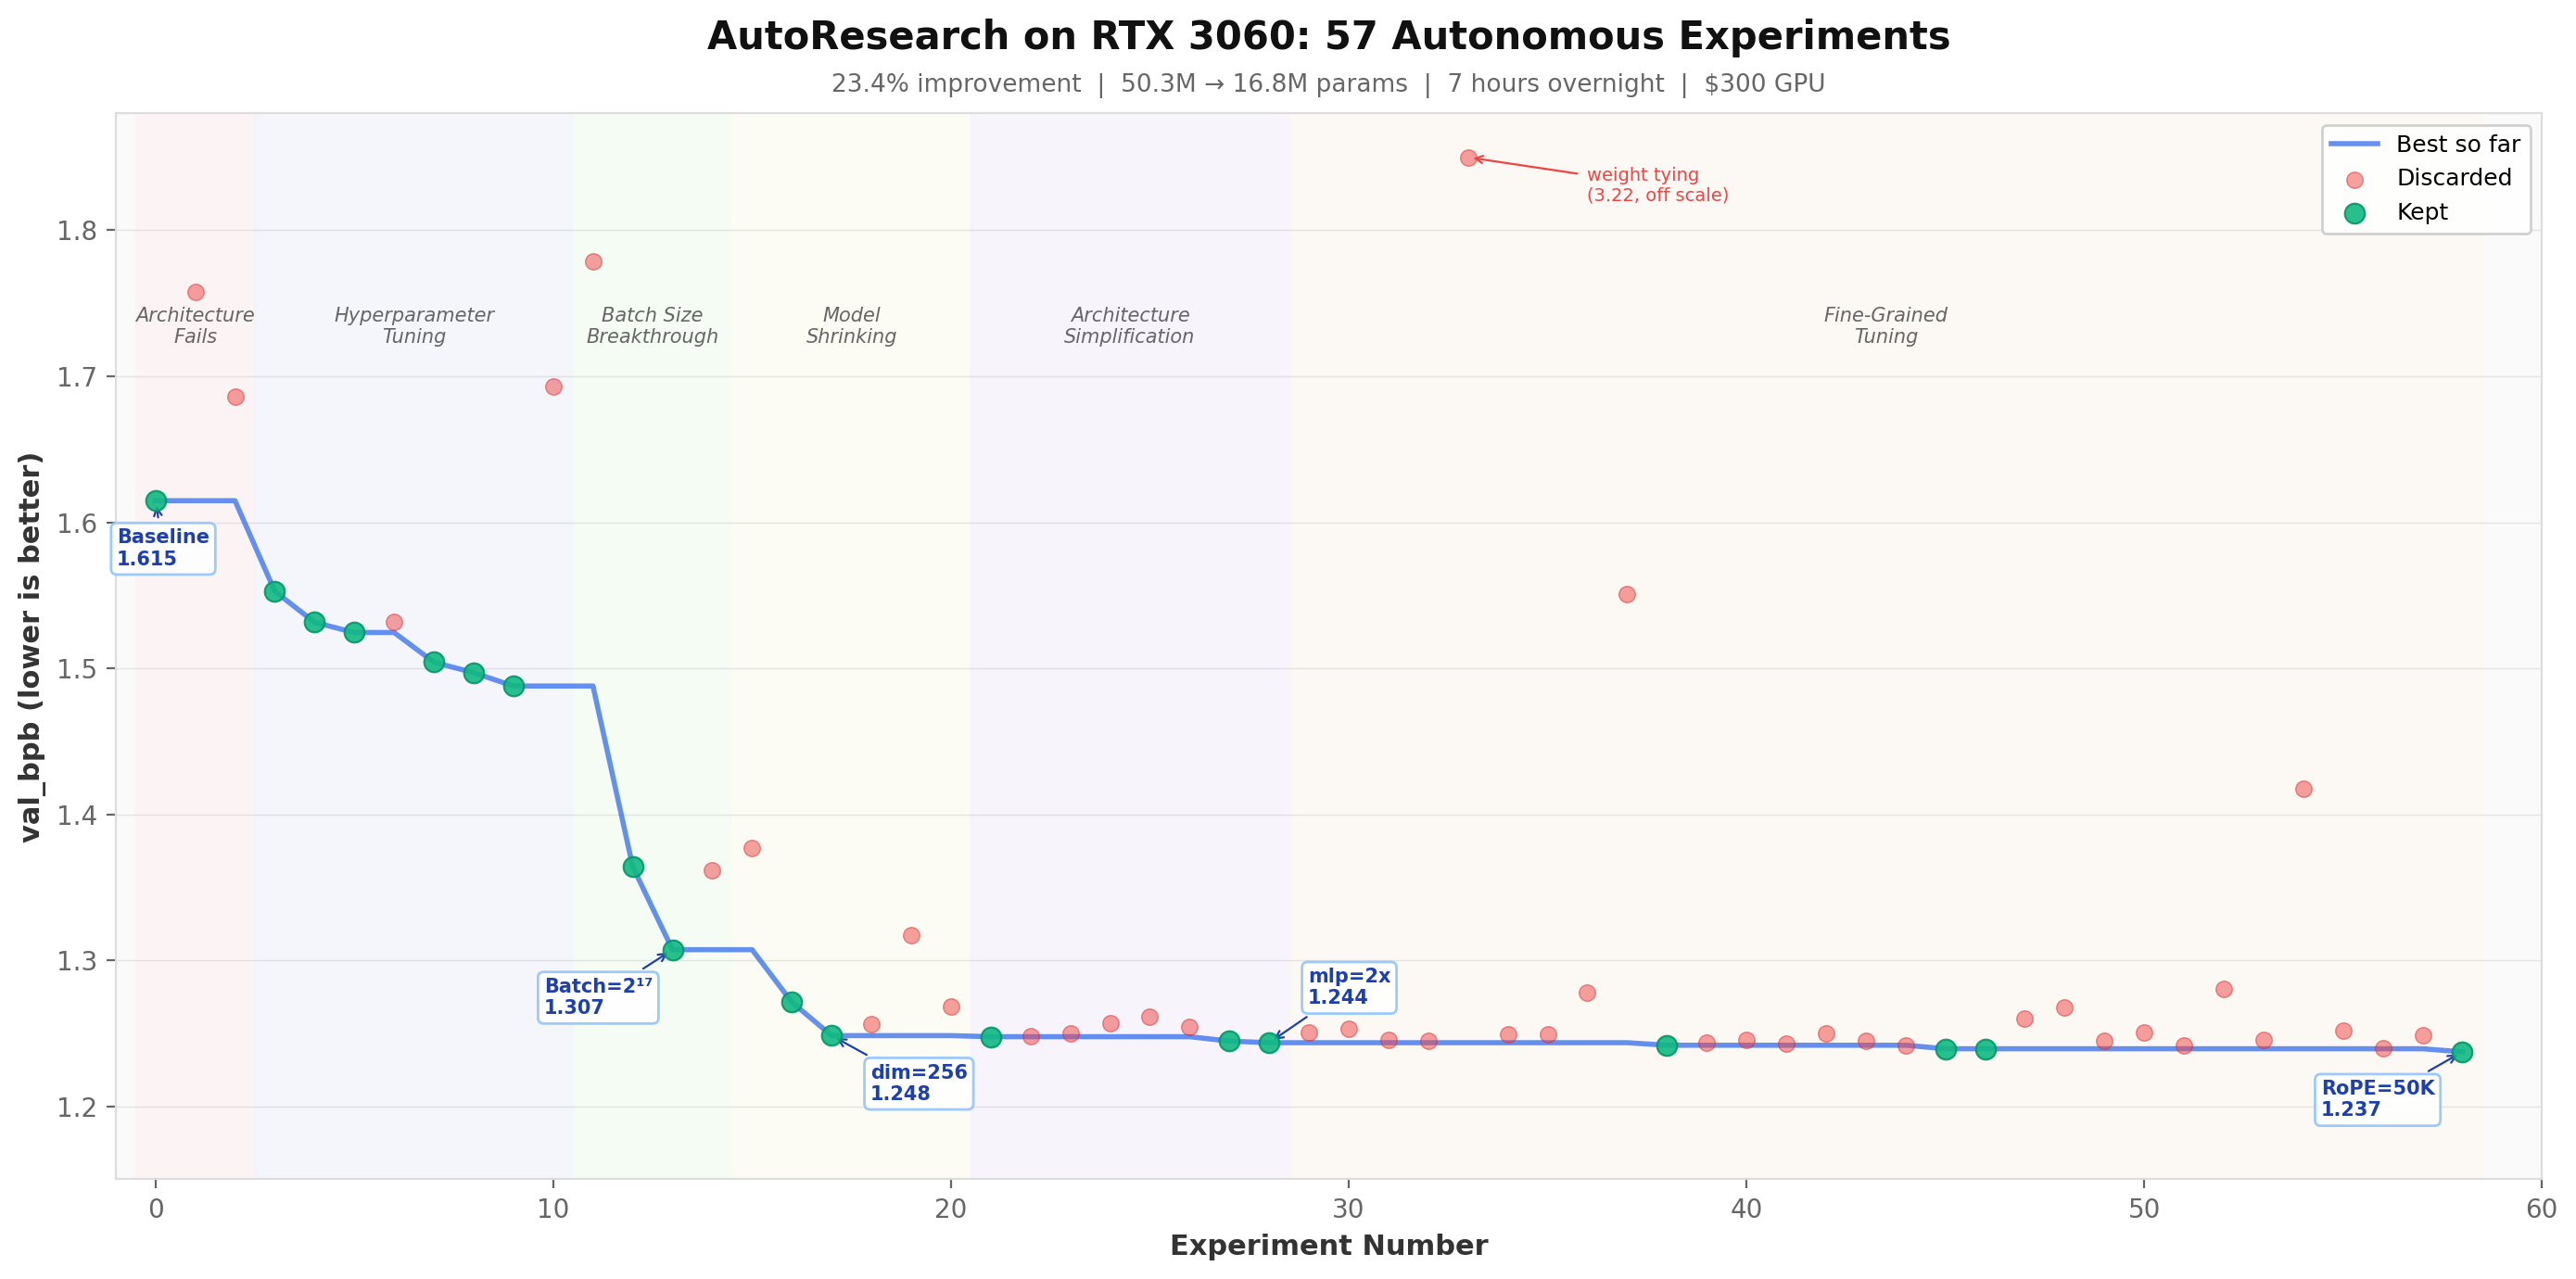
Phase 1: Architecture Fails, Hyperparameters Win (Experiments 1-11)
The agent’s first two moves were predictable: make the model bigger, make the activation function fancier.
Both failed.
Experiment 1 (DEPTH=10, 85.9M params): val_bpb 1.758, worse than baseline. The larger model consumed 9.2GB VRAM and completed only 39 steps instead of 58. With a fixed 5-minute budget, bigger model means fewer optimization steps. It couldn’t converge.
Experiment 2 (SwiGLU activation, 58.7M params): val_bpb 1.686, also worse. SwiGLU adds a gate projection. More parameters, slower steps, fewer iterations. The activation quality gain didn’t compensate.
Two failures. Both caused by the same mechanism: adding parameters costs steps under a fixed time budget.
The agent learned. It pivoted to hyperparameter tuning, which preserves model size and step count.
What followed was a clean binary search across learning rates: 0.06 (improved), 0.08 (improved), 0.10 (improved), 0.12 (overshot, discarded), settle at 0.10. Then embedding LR, weight decay, warmdown schedule. Each change kept the model at 50M params and 58 steps while squeezing more quality out of each step.
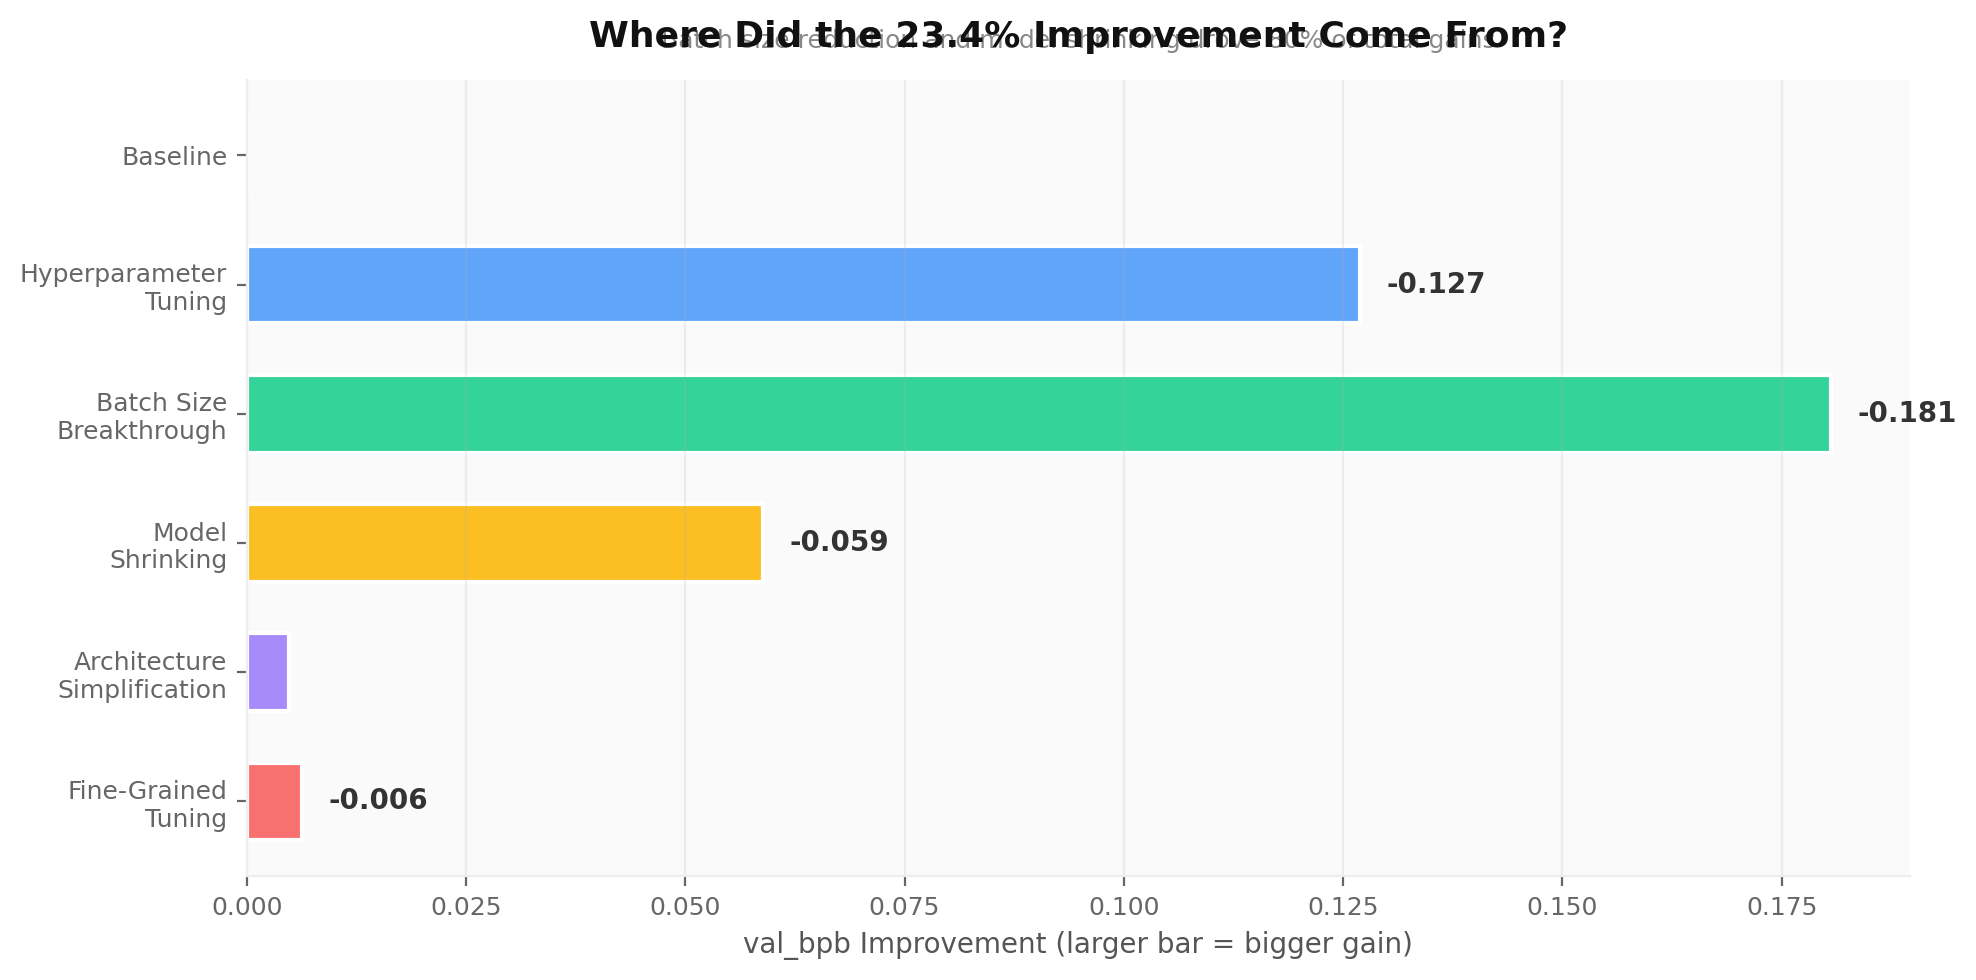
Result after 11 experiments: val_bpb dropped from 1.6148 to 1.4879. A 7.9% improvement from optimization alone.
One fun detail: the agent tried warmup=0.05 and it tanked performance. On a 58-step budget, spending 3 steps at low learning rate is a measurable waste.
Phase 2: The Batch Size Breakthrough (Experiments 12-15)
This is where the run got interesting.
The agent’s biggest single discovery: reduce TOTAL_BATCH_SIZE to get more optimizer steps per 5-minute run.
| TOTAL_BATCH_SIZE | Steps | val_bpb | Status |
|---|---|---|---|
| 2²⁰ (1M) | 34 | 1.779 | Discarded (too few steps) |
| 2¹⁸ (262K) | 103 | 1.364 | Kept |
| 2¹⁷ (131K) | 193 | 1.307 | Kept (best so far) |
| 2¹⁶ (65K) | 370 | 1.362 | Discarded (too noisy) |
Going from 58 steps to 193 steps dropped val_bpb by 0.18 in a single change. That’s a bigger improvement than all 11 hyperparameter experiments combined.
But 2¹⁶ (370 steps) was too far. With only 65K tokens per gradient update, the gradient estimates became too noisy. The sweet spot was 2¹⁷: 131K tokens per update, 193 steps per run.
This is counterintuitive. Standard ML practice optimizes batch size upward, not downward. Larger batches give cleaner gradients and better hardware utilization. That logic holds when your compute budget is flexible. Under a fixed time budget on constrained hardware, the agent discovered the opposite: more optimization steps matter more than cleaner gradients.
Phase 3: Smaller Models, More Steps (Experiments 16-21)
The agent took the batch size insight to its logical conclusion. If more steps help, and smaller models train faster per step, then shrinking the model should help too.
| Config | Params | Steps | val_bpb | Status |
|---|---|---|---|---|
| dim=384 (aspect=48) | 33M | 294 | 1.271 | Kept |
| dim=256 (aspect=32) | 18.9M | 480 | 1.248 | Kept |
| No value embeddings | 10.5M | — | 1.317 | Discarded (too small) |
| depth=12, dim=192 | 26.2M | 344 | 1.268 | Discarded |
The model went from 50.3M to 18.9M parameters. Steps per run went from 58 to 480. val_bpb improved with each shrink until 10.5M, where the model ran out of capacity.
The agent had discovered the optimal model size for a 5-minute RTX 3060 budget: ~17-19M parameters, 480-570 steps. Small enough to iterate fast, large enough to actually learn something.
Phase 4: Architecture Simplification (Experiments 22-30)
With the right model size locked in, the agent trimmed further. Full attention everywhere (ditching the SSSL window pattern). MLP expansion ratio from 4x down to 3x, then 2x. Each reduction shaved parameters, added steps, and improved slightly.
Final model: 16.8M params, 570 steps per run, 2.7GB VRAM.
Phase 5: Diminishing Returns (Experiments 31-57)
The agent explored 27 more changes with total improvement of only 0.005. Gradient clipping helped marginally. Muon momentum tuning helped marginally. RoPE base frequency from 10,000 to 50,000 helped marginally (the last kept experiment).
Some spectacular failures in this phase: weight tying cratered to val_bpb 3.21 (a learning rate conflict between shared embedding and output head). Label smoothing hit 1.55 (train/eval metric mismatch). Both were correctly discarded.
By experiment ~50, the agent was trying increasingly speculative changes (cosine warmdown, factored value embeddings, batch sizes between powers of 2) with everything regressing. The search space was effectively exhausted at this model scale.
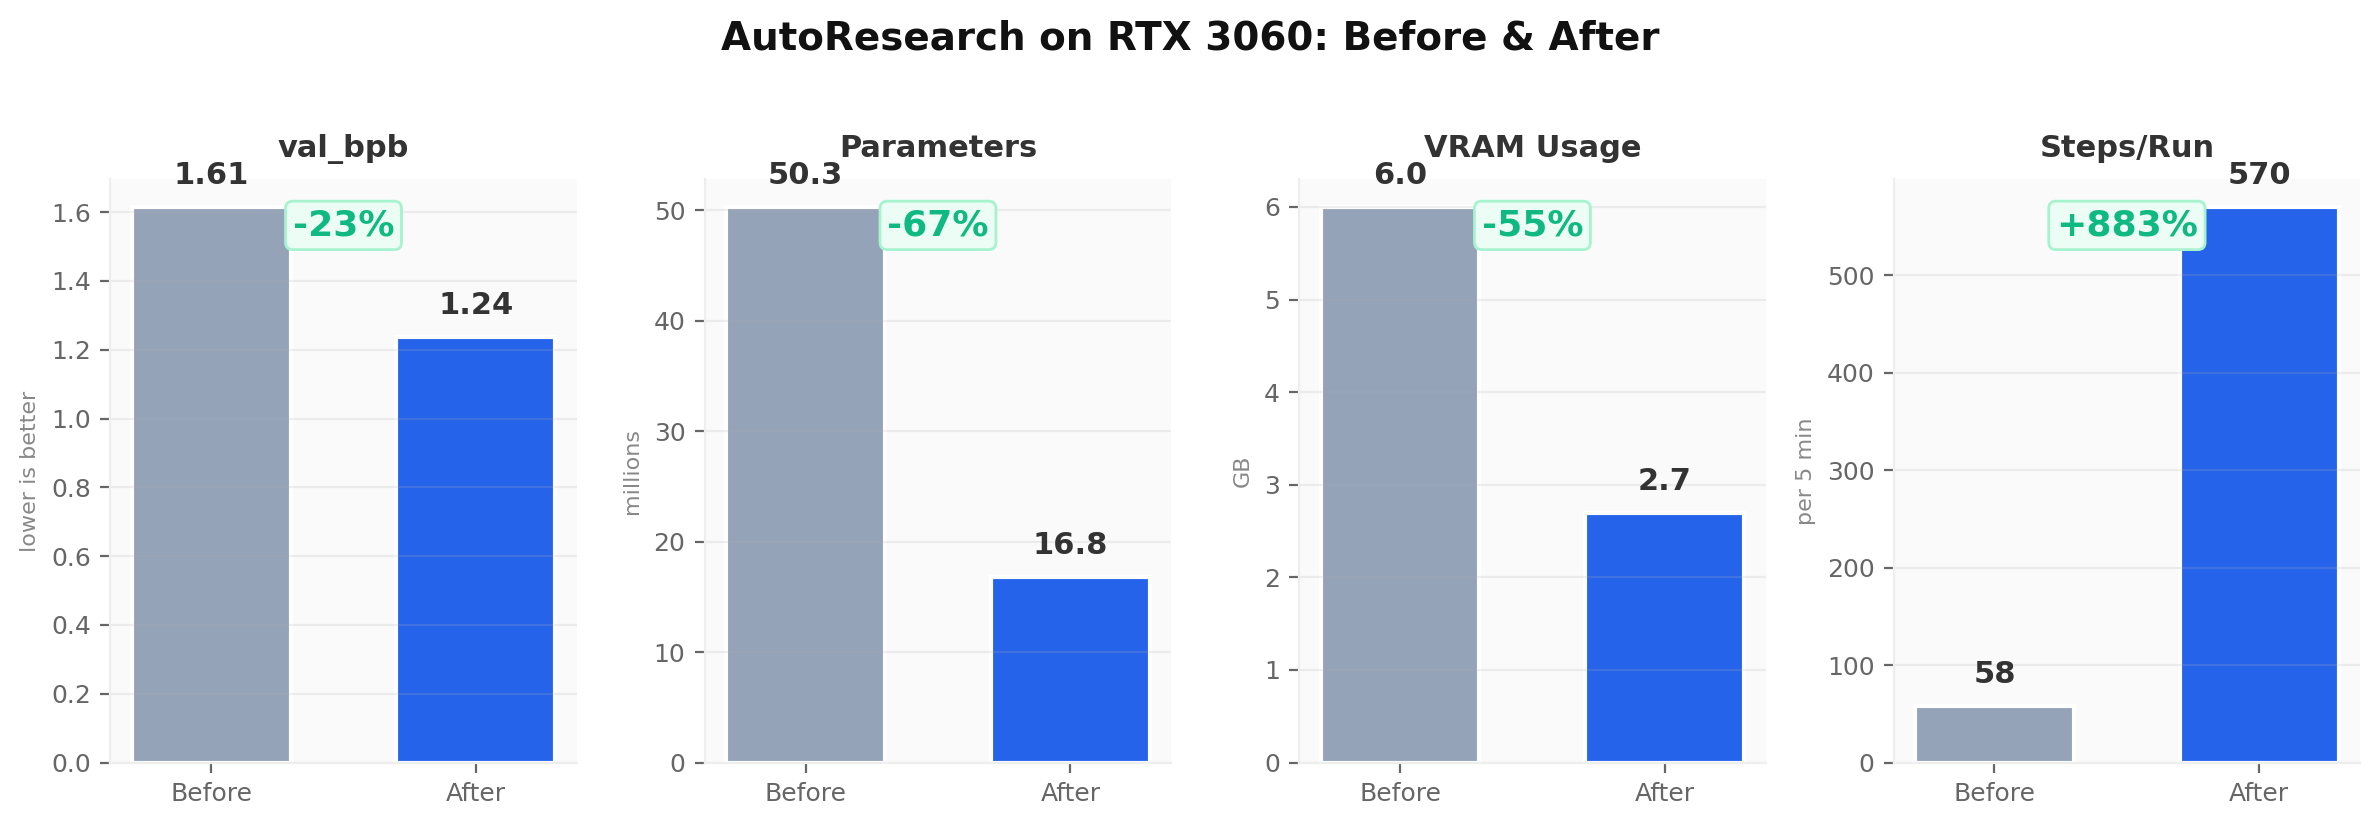
Final Results
| Metric | Baseline | Final | Change |
|---|---|---|---|
| val_bpb | 1.6148 | 1.2373 | -23.4% |
| Model params | 50.3M | 16.8M | -66.6% |
| VRAM usage | 6.0 GB | 2.7 GB | -55.0% |
| Steps per run | 58 | 570 | +883% |
| Batch size | 524K | 131K | -75.0% |
A 23% improvement in prediction quality. A model one-third the original size. Half the VRAM. Nearly 10x more training steps per run. All discovered autonomously by an agent running overnight on a consumer GPU.
Seven Things I Learned
1. VRAM is dominated by activations, not parameters. The 50M parameter model is ~100MB in bf16. Optimizer states add ~300MB. The attention score tensor at batch=128 needs 8GB per layer. On consumer GPUs, activation memory is the constraint, and batch size is the lever.
2. torch.compile hides memory from PyTorch’s tracking.
max_memory_allocated() reported 6,150MB. Batch=32 OOMed at 10,200MB. That’s a 4GB gap caused by torch.compile’s pre-allocated intermediate buffers. If you’re sizing batch by reported VRAM, you’ll hit OOM.
3. Batch size is quantized.
Gradient accumulation requires TOTAL_BATCH_SIZE % (device_batch × seq_len) == 0. With seq_len=2048, valid batch sizes jump by 2x. There’s no “try something in between.”
4. FA3 to SDPA is a clean swap. One tensor transpose, one lost feature (sliding window). PyTorch’s SDPA auto-dispatches to Flash Attention 2 on Ampere. Good enough.
5. Eval dominates wall time on small GPUs. Training: 305s. Eval: 197s. On the H100, eval is negligible. On the 3060, it’s 40% of wall time. Agent loop timeout needs adjustment or your experiments will get killed mid-eval.
6. The architecture transfers unchanged. Despite 6.7x less VRAM, the exact same model (50M params, 8 layers, 512 dim) runs fine at batch=16. The model is not the bottleneck. Throughput is.
7. Data placement matters. NVMe (~3.5GB/s) vs SATA (~500MB/s) for shard reads. At 80K tokens/sec throughput, SATA would throttle the dataloader. Data went on NVMe, symlinked from the cache directory.
What the Agent Actually Discovered
The technical results are useful. But the agent’s behavior is the more interesting story.
It learned through failure. Two architecture experiments failed by adding parameters. The agent pivoted to hyperparameter tuning (no parameter cost). Then it discovered the batch size lever (more steps for free). Then it cascaded that logic into model shrinking (even more steps by making the model smaller and faster).
This is a coherent optimization strategy that the agent assembled from sequential trial-and-error. Nobody told it “smaller is better on this hardware.” It found the constraint through two failed experiments and systematically exploited it.
The search trajectory looks like this: scale up (fails) → tune what you have (moderate gains) → restructure for more iterations (big gains) → shrink to the optimal size (big gains) → fine-tune at optimal size (diminishing returns). That’s not random. That’s emergent problem-solving under constraints.
What This Means Beyond LLM Training
AutoResearch runs a loop: propose a change, test it against a metric, keep or discard. The repo is built for LLM training. But the loop underneath is generic.
Any optimization problem where you can (a) define a score, (b) parameterize changes, and (c) test automatically fits this pattern. Expense classification accuracy. Call quality scoring. Pricing model error rates. Ad copy click-through rates. Template rendering performance (Shopify’s CEO pointed the same pattern at Liquid, Shopify’s 20-year-old Ruby template engine, and reported 53% faster rendering from 93 automated commits across ~120 experiments. He noted the results were “probably somewhat overfit,” but the structural optimizations the agent found were real).
The interesting finding from this 3060 run is that the agent doesn’t just tune parameters. It discovers structural insights about its constraints. It figured out that on this hardware, under this time budget, the optimal strategy inverts the usual scaling playbook. That kind of constraint-aware reasoning is what makes the loop more than just grid search with an LLM bolted on.
Running It Yourself
If you have an NVIDIA GPU with 8GB+ VRAM, you can do this. The community forks for Windows RTX cards and Apple Silicon are linked in Karpathy’s README. For a 3060 or similar Ampere card, the 4 changes I described above are the complete adaptation.
I used ClimbMix (Karpathy’s default dataset) with 8 shards. If you have less than 12GB VRAM, start with the TinyStories dataset instead (Karpathy recommends this for smaller GPUs), reduce vocab_size to 4096 or lower, and drop MAX_SEQ_LEN to 512 or 256. Set DEVICE_BATCH_SIZE to 8 or 16, then verify no OOM before launching the overnight loop. Run the agent in a tmux session so a dropped SSH connection doesn’t kill your run.
Expect ~7 experiments per hour on a 3060. ~50 overnight. That’s enough for the agent to discover meaningful optimizations if the search space has them.
The experiments are still running on our end. We’ll update this post as more results come in.
Mandar Gite is the founder of 72° AI Labs. We build AI solutions for Indian SMBs, and we test everything on real hardware before recommending it to clients. This is the first in our Experiment Log series.
Frequently Asked Questions
What is AutoResearch? AutoResearch is an open-source project by Andrej Karpathy that uses an AI agent to autonomously run experiments on a codebase, test changes against a metric, and keep or discard them. It was designed for LLM training but the pattern applies to any optimization problem with a measurable score.
Can I run AutoResearch on a consumer GPU? Yes. This post documents running it on an RTX 3060 (12GB VRAM, ~$300). Any NVIDIA GPU with 8GB+ VRAM can run it with the adaptations described: batch size reduction, Flash Attention 3 replaced with SDPA, and adjusted timeouts. Community forks exist for Windows RTX cards and Apple Silicon.
How many experiments can AutoResearch run overnight? On an RTX 3060, expect ~7 experiments per hour (vs ~12/hour on an H100). An overnight session of 7 hours produced 55 experiments before the context window filled. Two more ran in a resumed afternoon session for 57 total.
What results did the agent achieve on consumer hardware? The agent improved validation bits-per-byte by 23.4% (1.6148 to 1.2373), reduced model size by 66% (50M to 16.8M params), and cut VRAM usage by 55% (6GB to 2.7GB). All discovered autonomously through sequential experimentation.
Does AutoResearch only work for LLM training? No. The core loop (propose change, test against metric, keep or discard) is generic. It applies to any optimization problem: expense classification accuracy, call quality scoring, pricing model error rates, template rendering performance, or ad copy click-through rates.
What was the agent’s biggest discovery? Reducing batch size and model size to get more optimization steps per fixed time budget. This inverts the standard ML scaling playbook. On constrained hardware with a fixed time budget, more iterations beat larger models.
Tags: Machine Learning, AutoResearch, Consumer GPU, Andrej Karpathy, AI Research